While going through an old folder of mountaineering qualifications and course paperwork, I found a pile of weather charts pushed into the back.
They dated from around August 1996, when I was seventeen.
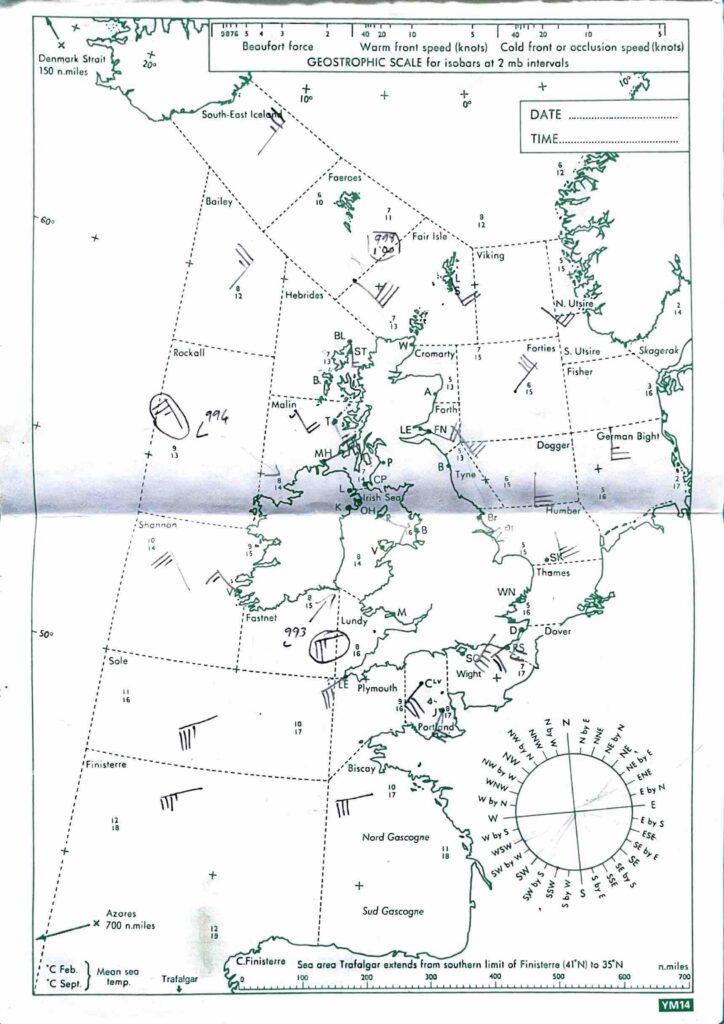
At first glance, they look like old maritime charts showing the sea areas around Britain and the North Atlantic. Scattered across them are wind arrows, pressure readings, roughly drawn areas of high and low pressure, and isobars that I had attempted to place by hand.
They were the remains of my time in the school meteorology club.
These days, I can take a phone from my pocket and look at several mountain forecasts, animated rainfall radar, wind speeds at different altitudes and a sequence of surface pressure charts.
In 1996, obtaining that information was rather different.
Surface pressure charts could be transmitted by fax but they were not something most people could simply call up whenever they wanted. Instead, we learned to create our own charts from information broadcast over the radio.
We recorded the BBC Radio 4 Shipping Forecast and worked through the descriptions of conditions across the different sea areas. The broadcast moved quickly. We had to write down the observations, including wind direction and strength, visibility, pressure and the approximate locations of high and low pressure systems.
We then transferred that information onto a blank chart, like the one pictured above. From those scattered observations, we attempted to work out the shape of the weather system and draw in the isobars (the lines joining places with equal atmospheric pressure).
Once we had reconstructed the current situation, we had to decide what the weather was likely to do next.
The following day, we could find out whether our forecast had been anywhere near correct.
I remember enjoying the challenge, although I would not describe it as easy.
The Shipping Forecast was delivered rapidly and contained a lot of unfamiliar information. Fortunately, we had recorded it, so we could stop the tape and listen again. Even then, correctly plotting every observation on the chart required concentration.
As part of the School Meteorology Club we completed one of these charts most weeks. That regular repetition gradually turned an abstract collection of symbols into something meaningful.
The wind arrows showed how air was circulating around the pressure systems: anticlockwise around lows and clockwise around highs and generally following the pattern of the isobars. More closely packed isobars indicated a steeper pressure gradient and therefore usually stronger winds. Changes in wind direction, together with the reported pressure and weather conditions, helped us identify fronts and the bends or troughs in the pressure pattern associated with them. The likely movement of those fronts then suggested where rain, stronger winds or other changing conditions might arrive next. Instead of simply being told what the weather would be, we were learning to understand why.
I used meteorology as the skill section of my Duke of Edinburgh’s Award but my real motivation was mountaineering.
I was already thinking about future adventures and the knowledge I would need to travel safely through the hills. Weather was clearly going to be a large part of that.
It was much the same reason I joined the cross country running club rather than concentrating on the traditional school sports of rugby and hockey. Running had a practical purpose: it would make me fitter for long days in the mountains.
At the time, cross country running did not seem to receive the recognition given to the main team sports. This was despite our school having an unusually successful cross country team. One of my school friends may still be slightly bitter that their achievements were apparently not considered worthy of school colours.
Perhaps the sight of our rather ramshackle collection of runners outperforming some of the more prestigious teams did not fit the expected picture. Our approach may have appeared relaxed, although that is not entirely how I remember the interval sessions up and down the headmaster’s steep drive.
Meteorology and running were both hobbies, but they were also pieces of a bigger plan. I was preparing myself for the mountains.
I no longer need to reconstruct an entire pressure chart from a radio broadcast before going walking.
Nevertheless, these skills have remained useful. When I look at a modern forecast, I have some understanding of the wider system behind the symbols. I can examine a pressure chart, see how the fronts are moving and consider how quickly conditions might change.
When I am on a mountain, I can relate what I am experiencing the direction of the wind, falling cloud, changing visibility or an approaching band of rain, to the forecast and the movement of the weather system.
Modern forecasts provide far more information than we had available in 1996 but they still require interpretation. Mountain weather is rarely as simple as looking at a single symbol and deciding that the day will be sunny or wet.
Finding those old sheets reminded me that knowledge is often built through repetitive and sometimes difficult exercises whose value only becomes obvious much later.
At seventeen, I was drawing isobars while listening to a recording of the Shipping Forecast. Nearly thirty years later, that understanding still influences the decisions I make in the mountains.